Chart with inline SVG
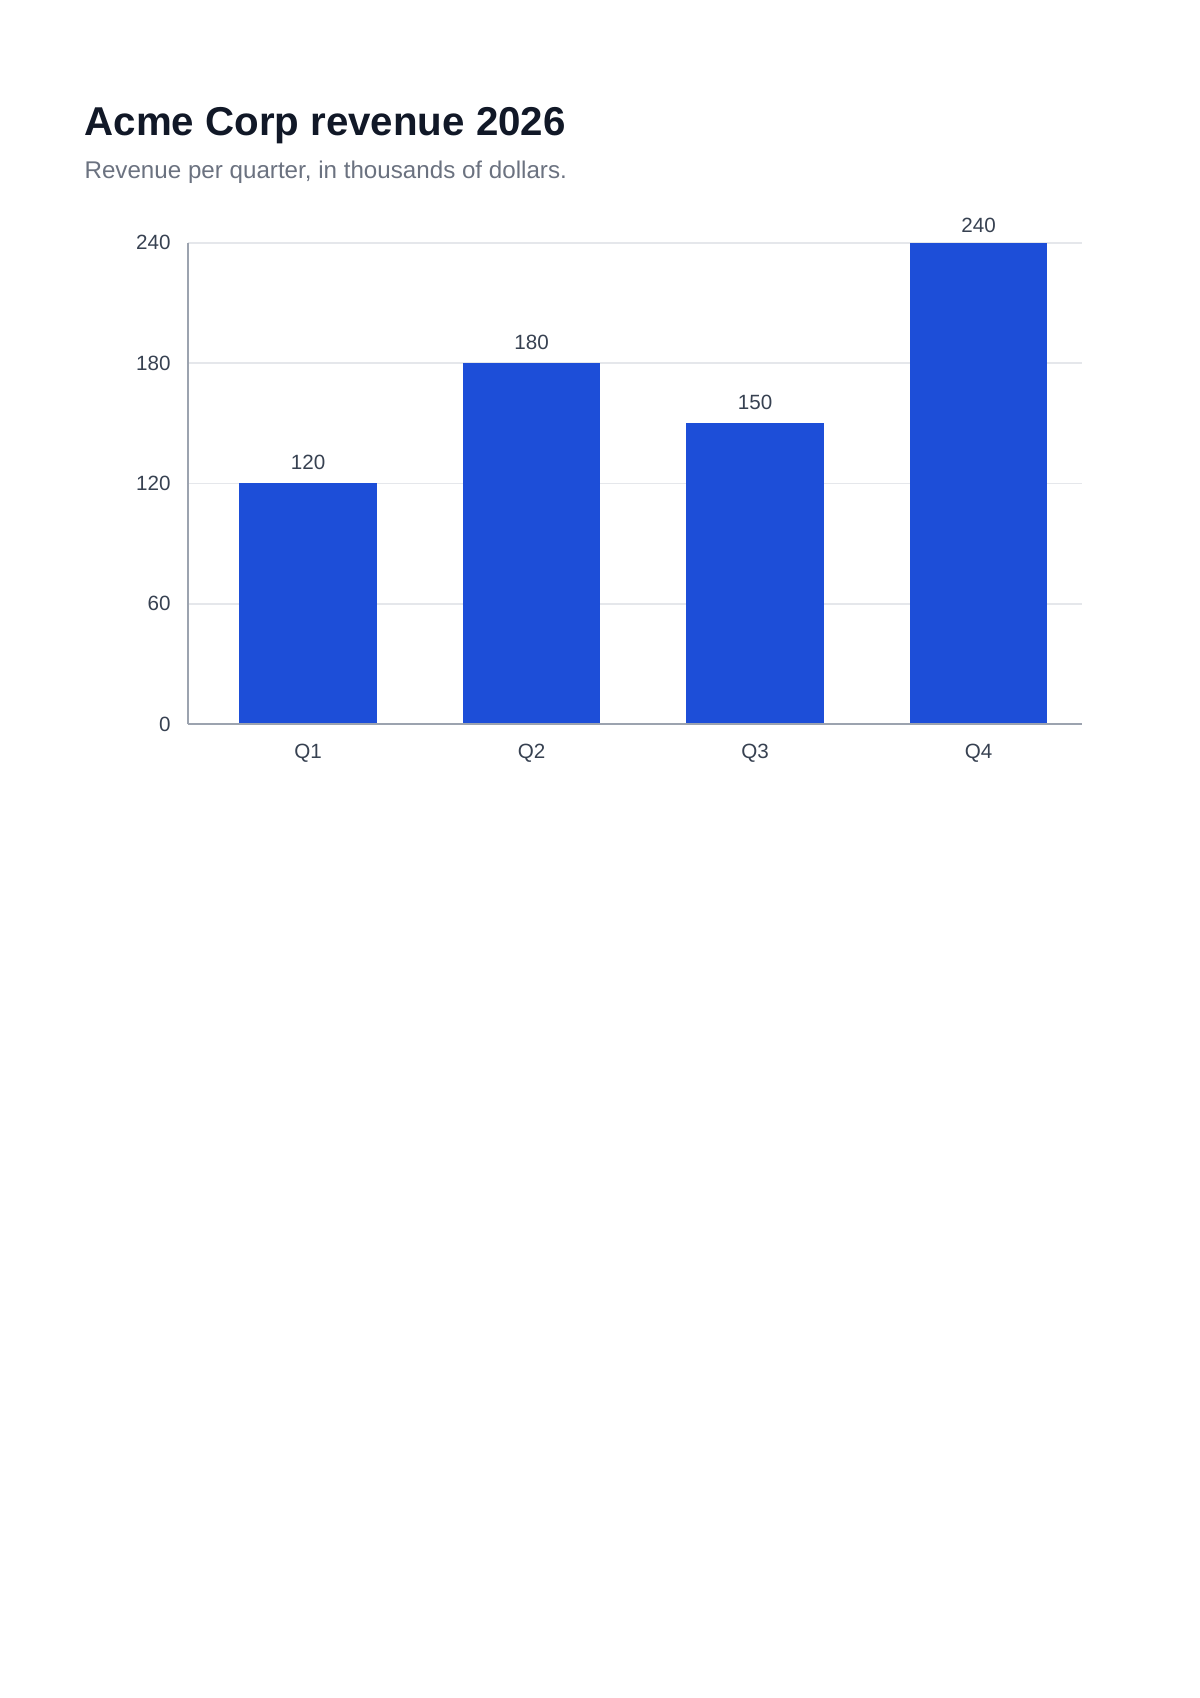
A bar chart drawn with inline SVG, rendered by Chromium.
A bar chart written by hand as inline <svg>, with bars, labels and axes, and no script.
HTML
Save the document as chart.html.
<!doctype html>
<html lang="en">
<head>
<meta charset="utf-8" />
<title>Quarterly revenue</title>
<style>
  body {
    font-family: sans-serif;
    color: #111827;
  }

  h1 {
    font-size: 20pt;
    margin-bottom: 2mm;
  }

  .subtitle {
    color: #6b7280;
    margin-top: 0;
  }

  svg {
    width: 100%;
    height: auto;
  }

  svg text {
    font-family: sans-serif;
    font-size: 12px;
    fill: #374151;
  }

  .bar {
    fill: #1d4ed8;
  }

  .axis {
    stroke: #9ca3af;
    stroke-width: 1;
  }

  .grid {
    stroke: #e5e7eb;
    stroke-width: 1;
  }
</style>
</head>
<body>
  <h1>Acme Corp revenue 2026</h1>
  <p class="subtitle">Revenue per quarter, in thousands of dollars.</p>

  <svg viewBox="0 0 600 340" role="img" aria-label="Revenue per quarter: Q1 120, Q2 180, Q3 150, Q4 240">
    <!-- Plot area: x from 60 to 580, y from 20 (240k) to 300 (0). 1k = 280 / 240 px. -->
    <line class="grid" x1="60" y1="20" x2="580" y2="20" />
    <line class="grid" x1="60" y1="90" x2="580" y2="90" />
    <line class="grid" x1="60" y1="160" x2="580" y2="160" />
    <line class="grid" x1="60" y1="230" x2="580" y2="230" />

    <text x="50" y="24" text-anchor="end">240</text>
    <text x="50" y="94" text-anchor="end">180</text>
    <text x="50" y="164" text-anchor="end">120</text>
    <text x="50" y="234" text-anchor="end">60</text>
    <text x="50" y="304" text-anchor="end">0</text>

    <rect class="bar" x="90" y="160" width="80" height="140" />
    <rect class="bar" x="220" y="90" width="80" height="210" />
    <rect class="bar" x="350" y="125" width="80" height="175" />
    <rect class="bar" x="480" y="20" width="80" height="280" />

    <text x="130" y="152" text-anchor="middle">120</text>
    <text x="260" y="82" text-anchor="middle">180</text>
    <text x="390" y="117" text-anchor="middle">150</text>
    <text x="520" y="14" text-anchor="middle">240</text>

    <line class="axis" x1="60" y1="300" x2="580" y2="300" />
    <line class="axis" x1="60" y1="20" x2="60" y2="300" />

    <text x="130" y="320" text-anchor="middle">Q1</text>
    <text x="260" y="320" text-anchor="middle">Q2</text>
    <text x="390" y="320" text-anchor="middle">Q3</text>
    <text x="520" y="320" text-anchor="middle">Q4</text>
  </svg>
</body>
</html>
Request
Each sample reads chart.html and saves the PDF as chart.pdf. The cURL sample builds the JSON body with jq.
jq -n --rawfile html chart.html \
  '{ engine: "chromium", html: $html }' \
  | curl https://api.eu.revecto.dev/v1/convert \
    -H "Authorization: Bearer $REVECTO_API_KEY" \
    -H "Content-Type: application/json" \
    --data-binary @- \
    --fail-with-body \
    -o chart.pdf
Result
See also: Chromium.